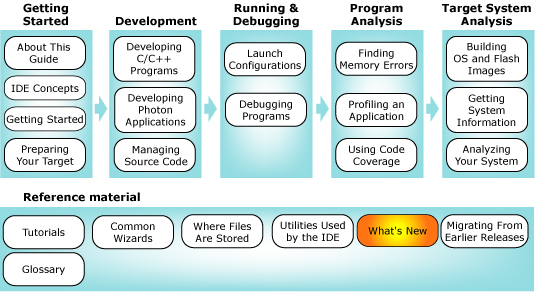
You can select a topic from this diagram:
This chapter identifies the changes made to the QNX Momentics IDE.
In this chapter:
The IDE includes the following new features:
- Integration with the Eclipse 3.3 Platform. For more information about the changes in the Eclipse project, see:
http://www.eclipse.org/projects/project_summary.php?projectid=eclipse.
- Integration with CDT 4.0 -- For additional information about the changes in the CDT project, see:
http://www.eclipse.org/projects/project_summary.php?projectid=tools.cdt.
In particular, new to the C/C++ development are the following:
- One of the first changes you'll see if you've used previous versions of the IDE is that when creating projects you do not need to select between Standard and Managed C and C++ project. You simply select C or C++ project. This will launch the CDT new project wizard. In this wizard you can pick between different project types. Makefile projects are almost the same as Standard Make projects. The main addition with Makefile projects is the ability to tell the CDT which toolchain you are using which will help the CDT with various tasks such as source navigation into system header files. All other project types are the same as Managed Make projects in IDE 4. For information about the new New Project wizard, see "Creating a C/C++ project."
For information about creating these types of projects, see "Creating the equivalent of a make project."
For information about creating a project using the new project wizard, see "Creating a C/C++ project" and "Creating projects."
- The new QNX launch and debug shortcut adopts to the new CDT launch and debug framework. It is enhanced to have the ability to detect and associate binaries to remote targets architecture. It's more user friendly since it does most of the work to populate enough information in the launch configuration, and only requires user attention for the launch configuration dialog, while multiple choices are available. For more information, see "Running and debugging for the first time."
For information about launching and debugging, see "Debugging your program", "Controlling your debug session", and "More debugging features."
- Included support for Subversion (the SVN Team Provider and Subversive SVN connectors). For information about SVN in the IDE, see "SVN and the IDE."
- The IDE includes managed build definitions for qcc.
- There is a new Target tab for build properties on Makefile projects to select a qcc target architecture.
- For scanner discovery, the IDE has a build output parser, as well as scanner discovery for built-ins for qcc.
- IDE 4.0.1 to IDE 4.5 is equipped with project conversion for managed build projects. For information about this conversion process, see "Converting a regular project to a managed make C/C++ project."
- QNX Project to CDT managed build project conversion -- The IDE includes managed make C/C++ Projects. Although already part of the CDT, the IDE includes customizations that make it integrated with the QNX Neutrino build environment. For example, the New C/C++ Project Wizard lets you select a target processor, such as x86, and a compiler version (gcc 4.2 is available in version 6.4.0 only). In addition, the managed make lets you build from outside the IDE using the command line. Container projects also include support for managed make projects. For information about project conversion, see "Converting a QNX project to a managed make C/C++ project."
 |
The 6.4.0 release doesn't include a version of the IDE running on QNX Neutrino host systems. |
The C and C++ development environment includes the following changes:
- Enhancements:
- Launch and Debug -- The new QNX launch and debug shortcut conforms to the new CDT launch and debug framework. It is enhanced to have the ability to detect and associate binaries to the remote target's architecture. Wherever possible, it prepopulates information in the launch configuration, and only requires your input to the launch the configuration dialog when multiple choices are available.
- Added a converter to automatically convert QNX Projects to managed Make Projects. For information about the Convert to Managed Project converter, see "Converting a QNX project to a managed make C/C++ project."
- The IDE includes a managed build integration for the QNX tool chain.
- Additional tuning of the container project import process and the IDE responsiveness after the import completes (significant improvement for your large workspaces).
- Improvements to the C/C++ Editor experience through user preferences (available by selecting )so that you can:
- Set color identifiers in the source code according to their role, such as typedefs, functions, variables, and fields ()
- Exclude Make code by conditional compilation with a grey background ()
- Collapse and expand blocks of comments and preprocessor branches in C and C++ files in addition to functions, structures, and so on ()
- Set a configurable code formatter with four predefined styles ()
- Set typing assistance options, such as the closing of brackets, smart paste, and more ()
- The IDE now includes support for parallel building for QNX Projects. For information about the Use parallel build option, see "Behaviour tab."
- Corrections:
|
For additional information about the corrections that were made to the IDE, see "List of fixes" in the Release Notes. |
- The following issues have been addressed with respect to QNX container projects:
- Increased speed when importing a container project.
- Resolved a problem with workspace consistency after reimporting a container project.
- Fixed the workspace refresh problem after importing a container project. Occasionally, the IDE didn't refresh the project view without restarting, or sometimes showed only the root container without any of its corresponding components.
- The order of components in container project (and the build order) after import is now correct.
- Addressed a deadlock issue during the import operation for container project.
- Addressed the issue of stripping on non-x86 platforms.
- Fixed some bugs in container projects (these issues were mostly in the UI presentation of the build configuration for the container project and build target specification.)
- Addressed the "out of memory" problem when loading excessively large binaries for navigation in the C/C++ View.
- Fixed a problem with process monitoring. Previously, a process on the target machine was deliberately closing stdout/stderr.
- When you build a container project and set the Stop on error option in the build configuration, now if an error occurs in one of the projects, the build correctly stops.
System information and target management includes the following changes:
- The QNX System Information enhancements with malloc information view that includes various charts to help you observe changes in memory usage (allocations and deallocations). Because it is important for you to know when and where memory is being consumed within an application, the Memory Analysis Tooling feature includes several views that use the trace information from the Memory Analysis session to help extract and visually show this information (to determine memory usage; allocation and deallocation metrics). The IDE includes these new views to help you observe changes in memory over time: Outstanding allocations, Allocation deltas, Deallocation deltas, and Outstanding allocation deltas. For more information, see "Observing changes in memory usage (allocations and deallocations)".
|
To begin to view data on your graphs, you need to set logging for the target, and you need to select an initial process from the Target Navigator view.
|
- For Target Management, the IDE includes a new Terminal view with support for Telnet, SSH, various file transfer protocols, and includes full customization for fonts, colors, and sizes (available in Preferences).
- Improved drag and drop capabilities to and from the Target Navigator view.
- The File System navigator now supports the Rename operation.
The Application Profiler includes the following changes:
- Enhancements:
- Function enter and exit time instrumentation -- The Execution Time view provides you with information about the duration of time that the processor spends in each function, as well as stack trace and call count information.
- Call Tree/Reverse Call Tree modes -- The call tree mode (Show Calls menu option) shows you a list of all of the functions called by the selected function. This call tree view lets you "drill down" into specific call traces to analyze which ones have the greatest performance impact, whereas the reverse call tree mode (Show Reverse Calls menu option) shows you what is calling a specific function, and how its time was distributed for each of those callers.
- Context menu navigation -- An easy to use context menu navigation is available for each node of the tree, table, or call graph.
- A new Profiler Sessions view with sessions persistence -- For detailed information about the view, see "Profiler Sessions view."
- Comparing profiler sessions -- You can compare profiles to see the difference between two profile sessions. For example, you might want to compare two profiles to evaluate the results of their profiles before, and after, you perform function optimization.
- Session snapshot tool -- Taking a snapshot of a profiling session lets you freeze the current state of the Application Profiler data while the actual session data keeps changing. The snapshot data remains frozen and can later be compared with the final results, or other snapshots of the same session.
- Pausing and resuming a profiling session -- you can specify when to when to enable profiling during the execution of an application.
- View cloning -- Duplicating the view lets you create a second Execution Time view to see data side-by-side in another window.
- History navigation -- Viewing history lets you keep track and maintain a record of where you have been.
- Data Grouping -- Lets you group profiling information to organize large function tables, and improve navigation and analysis.
- Importing Profiler Session data -- You can create a profiler session by importing .gmon, .kev, or .ptrace files using the Import action from the Profiler Sessions view. For more information about importing profiler data, see "Creating a profiler session by importing profiler data".
- View integration -- The Sessions view was renamed to "Profiler Sessions view", and the Sampling Information view was consolidated; the information is now available in a more robust view called the "Execution Time view."
- Copy to the clipboard -- Lets you see the table or tree data in textual format.
- View Filtering -- Filtering lets you remove some rows from the table to see only those records related to the specified component, or you can use Data filtering to filter based on timing values.
- Search in Tree view -- Searching lets you perform a text search on the data results from the profile. The Find feature includes a Find bar at the bottom of the Execution Time view. The view automatically expands and highlights the nodes in the tree when the search locates results that match the search criteria.
- Annotated source editor improvements -- The editor now shows a solid or graduated color bar graph on the left side, depending on the percentage of time spent in the function. In addition, the IDE provides the amount of time on a line-by-line basis, as well as a tooltip with additional information.
- Export and Import from .xml, and export to .csv (excel) -- For information about importing and exporting profiler sessions, see "Exporting a profiler session" and "Creating a profiler session by importing profiler data".
- Profiling a running process () -- Profiling a running process
The System Profiler includes the following changes:
- Enhancements:
- The ability to launch with profiling capabilities. Integration with the GCC compiler for instrumented function profiling -- The IDE is integrated with the GCC 4.2 complier to provide you with powerful profiling capabilities. You can build your executables with profiling enabled, and the QNX Application Profiler can provide call-pair information (i.e. which functions called which). For additional information, see "Using the results from Functions Instrumentation mode in the System Profiler."
- The icons previously removed from the Trace Log view have been returned.
- The event owner labels are now consistent throughout the IDE, and can be configured using Preferences to show the name, ID, or both.
- The Summary page shows you more information about the log, including how many dropped buffers occurred, and the total number of events.
- The Trace Log view incorporates a new column to show the real time of an event. The start of the log file is based on the DATE property in the log file. You can include additional precision by setting the start time value in the resource property.
- The IDE uses an address translation for interrupt IP events. The log file must be matched with the binary files in your workspace for address
decoding to occur.
- Kernel log capturing is added to the Application Launch configuration as an additional tool. Now, you can start logging at the same time you start an application.
- The Summary view now shows additional information about the dropped buffers if any are observed in the log file.
- Corrections: For additional information about the corrections that were made to the IDE, see "List of fixes" in the Release Notes.
The System Builder includes the following changes:
- Enhancements:
- Replaced the existing terminal with a DSDP terminal view, which includes Com, Telnet and SSH connections.
- Added the ability to import an entire directory at once.
- Corrections:
|
For additional information about the corrections that were made to the IDE, see "List of fixes" in the Release Notes.
|
- Addressed the permission problem that occurred when starting a TFTP server on Linux & Neutrino.
- Fixed the export capabilities of the build file export feature.
The QNX Memory Analysis tool includes the following changes:
- Enhancements:
- The Memory Analysis Tool lets you import and export trace data from a Memory Analysis session view. With the Memory Analysis Tool, you can:
- Export session information in CSV or XML format. In the IDE, you can export your trace data session information from a Memory Analysis session
view. When exporting memory analysis information, the IDE lets you export results in .csv format or in .xml format. Later, you can import the event-specific results into a spreadsheet, or you can choose to import session data back into a Memory Analysis tool to review the results. To export, click from the menu, and then select . For information about exporting, see "Exporting memory analysis data."
- Import memory analysis sessions from a trace file or XML format. In the IDE, you can import memory events and memory errors from a Memory Analysis
session view. When importing memory analysis session information, the IDE lets you import from libmalloc trace file (generated on the target), or from previously exported session data in XML format. To import, click from the main menu, select , and then follow the instructions in the wizard. For information about importing, see "Importing memory analysis data".
- Minor usability improvements to rename labels on charts and columns.
- Added the scroll lock action to prevent the view from refreshing.
- The Memory analysis tool supports an improved library that replaces libmalloc, called librcheck.
- There is backtrace support included for a non x86 target and C++ code.
- There is optimized code for the runtime library and events loading code in IDE.
- The IDE also includes added support for the New and Delete as memory events.
- Corrections:
|
For additional information about the corrections that were made to the IDE, see "List of fixes" in the Release Notes.
|
- You'll notice performance improvements with the Memory Analysis Tooling application if you use the various Memory Errors options (available on the Memory Applications tab in the Launch configuration); however, there are no performance improvements in the area of memory events collection.
- Fixed a problem with zooming and filtering on the Allocation chart.
The QNX Debugger includes the following changes:
- Enhancements:
- JTAG Debugging: There is a new debug launch configuration to support "GDB Hardware Debug" through the JTAG interface. There is built-in support for the Abatron BDI2000 and Macraigor USB2Demon JTAG devices, with other device support, such as the Lauterbach Trace32 In-Circuit Debugger, through self-defined hardware specific command sets. For more information about JTag debugging, see "Using JTAG debugging".
- A new option Go To Address was added to the Disassembly view that lets you view an arbitrary address. For more information about Go To Address, see "Jumping to a memory address in the Disassembly view".
- Added the View Memory feature in the Variable view that lets you see a variable in memory. For information about this feature, see "Viewing variables in memory".
- In the Launch Configuration, the Debug tab was updated for QNX Qconn and QNX Pdebug launches to include a debugger selection box and a verbose mode option. Verbose console mode shows the details of the interaction with the command line debugger in the gdb process console. This option can be enabled from launch configuration, or by right-clicking on the process in the Debug view. For additional information about these features, see "Debugger tab", and "Types of launch configurations."
- You can also set breakpoint actions directly from the Breakpoint view using a new GDB breakpoints actions page called GDB Command Action. This features lets you specify GDB commands; one command per line. You can define a GDB command action, and attach it to one or more breakpoints. When the IDE encounters a breakpoint, the defined GDB command(s) will run, and the result shows in the GDB console. There is also a new global preference GDB Command Action page that you can access by selecting . This preference page lets you define one of more reusable GDB command actions that you can attach to a breakpoint at a later time. For more information, see "Setting an action for the breakpoint".
- For the source locator, an absolute path mapping entry was added to the global preferences (). This means that for a large project that is compiled on the same host as the IDE runs, it will use this location instead of the default source location specified on the Source tab in the Launch configuration.
- On the Debug tab for a Launch Configuration, there is a new option, called Use full path to set breakpoints, that lets you set breakpoints using the full file name. If you have many files with the same base name in the project, selecting this option is the preferred method of setting breakpoints. For additional information, see "Debugger tab" and see "Setting an action for the breakpoint".
- The IDE now lets you edit the line number for a breakpoint. Right-click on the breakpoint, select Properties, select the Common tab, and then edit the line number. In addition, you can also move the line number of the existing breakpoint. To show line numbers in an editor, select the Show line numbers option from .
- Added support for GDB catchpoints such that you can set event breakpoints for these types of events: exception caught and exception thrown. For more information, see "add event breakpoints".
- Corrections:
|
For additional information about the corrections that were made to the IDE, see "List of fixes" in the Release Notes. |
- Addressed a problem with the UI being deadlocked, and debugger UI being unresponsive during the launch, and in some other situations.
- Hardcoded timeouts for a suspend operation have been fixed such that the default MI command timeout will be used. This command is user configurable.
- When an error occurs during a launch, the IDE is now able to successfully close unresponsive debug sessions.
- Fixed a problem where, in some situations, the debugger was encountering disabled breakpoints, and not being able to encounter enabled ones.
- You can now view base class members in the Variables view.
- Fixed the shared library loading for gdb version 6.7.
- When a breakpoint is set from the gdb console using an address, you can now successfully navigate to the breakpoint source code.
- Fixed postmortem debugging in that you can now pass the user defined shared libraries path to the debugger. In addition, there are also some corrections to gdb where the IDE now supports gdb 6.7 update 5 or higher.
- Very long variables now show correctly.
Cove Coverage includes the following changes:
- Enhancements:
- The IDE includes support for gcc 4.2.
- For calculating totals, the IDE takes advantage of using line coverage instead of using basic block coverage to provide more accuracy with the results totals.
- To further improve data accuracy, the statistics for functions defined in the header are now excluded from source file coverage.
- Added an option called Collect data for that lets you specify selective data collection in order to improve scalability. For more information about this feature, see "Starting a coverage-enabled program".
- You can now import coverage data from a remote target. For information about importing, see "Importing gcc code coverage data from a project".
- Corrections:
|
For additional information about the corrections that were made to the IDE, see "List of fixes" in the Release Notes. |
- Fixed code coverage calculation for functions defined in header files.
- Addressed some major issues regarding code generated by contemporary C++ compilers.
- The IDE was updated to gcc version 4.2.; we no longer ship versions 2.95.3 or 3.3.5.
- The Intel 8.1 compiler was discontinued, icc.
- When you use the -Os option with gcc to optimize for size, you'll no longer receive certain compile errors.
![[Previous]](prev.gif)
![[Contents]](contents.gif)
![[Index]](keyword_index.gif)
![[Next]](next.gif)
